

How to view a track for several dates (period)?
Goto to the monitoring map. Click on date selection on additional menu above the map.
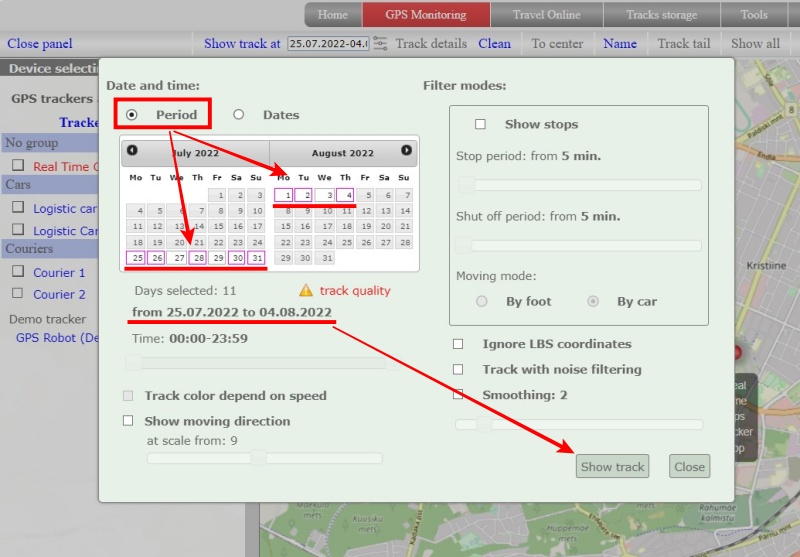
In the window that opens:
- Make sure that the “Period” switch is above the calendar. If it's not installed, install it.
- In the calendar, click on the first date of the period
- In the calendar, click on the last date of the period. Please note that the period cannot be more than 31 days.
- Selected dates should change color to white
- Click the “Show track” button
An example of selected dates. The selected period is from July 25 to August 4. The background of selected dates is white.
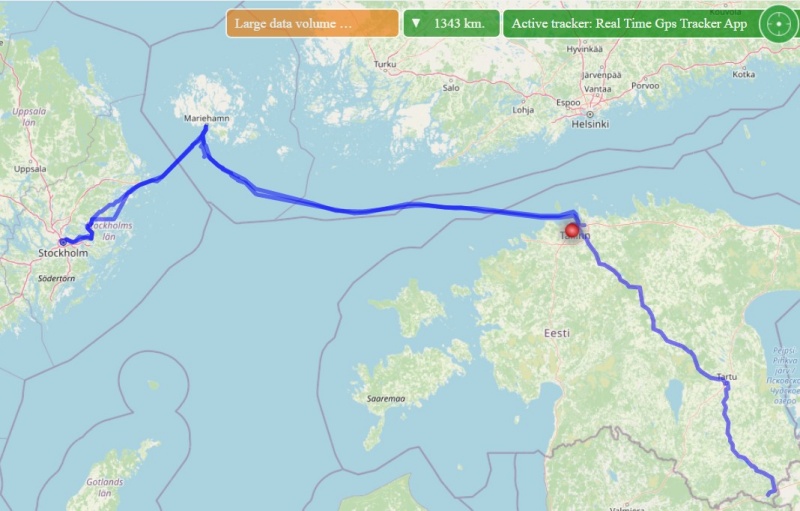
Track built for the selected period:
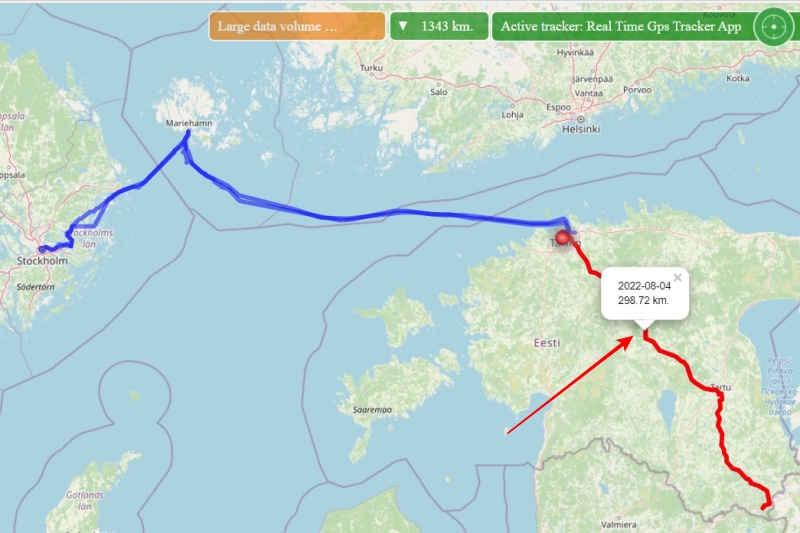
How to see for what day the track?
To do this, you can click on the track on the map. The track will be highlighted in red and an information box will appear with the date of that track The information window can be closed by clicking on any part of the map (except for the track or the window itself). Then only the selection of the track itself will remain. To remove the selection from the track, you need to click on any part of it again.
 Limitations when building tracks for periods
- The selected period cannot be more than 31 days
- When building a track for a period, you cannot select a time. The track is being built from 00:00 of the first day to 23:59 of the last day
- The setting “Track color depending on speed” is not available.
In addition, it should be understood that when building a track for a period, the amount of data displayed on the map can be so large that the power of your computer and the capabilities of any of the existing browsers simply may not be enough. To avoid such a situation, we make a forced filtering of the track and can display not all points on the map.
Undoubtedly, we tried to strike a balance between the “beautifulness” of the track and the extreme capabilities of browsers. But in some cases, the detail of the track can be greatly reduced.
How to understand how many track points are displayed on the map and that the track was forcibly filtered?
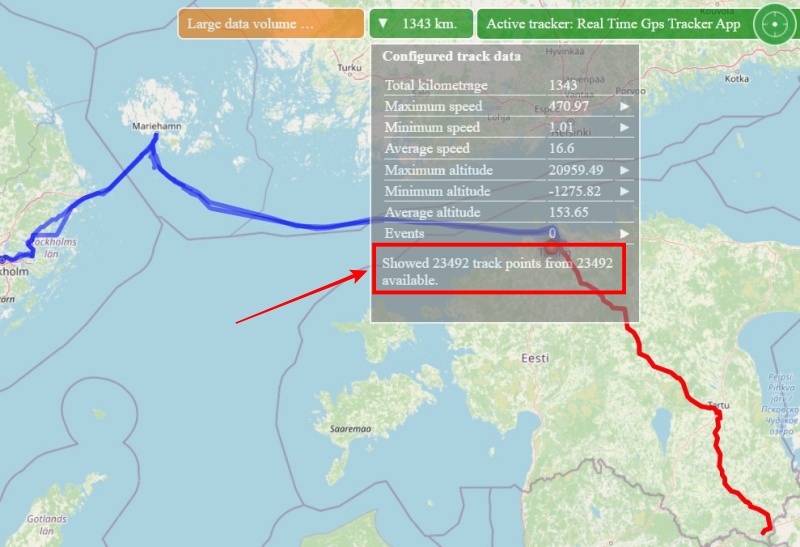
After the track appears on the map, several panels will also appear. One of them is “Large data volume…”. This means that the number of track points for the selected period exceeds the ability to display them all. If you click on this panel, an information window with a detailed description will be opened.
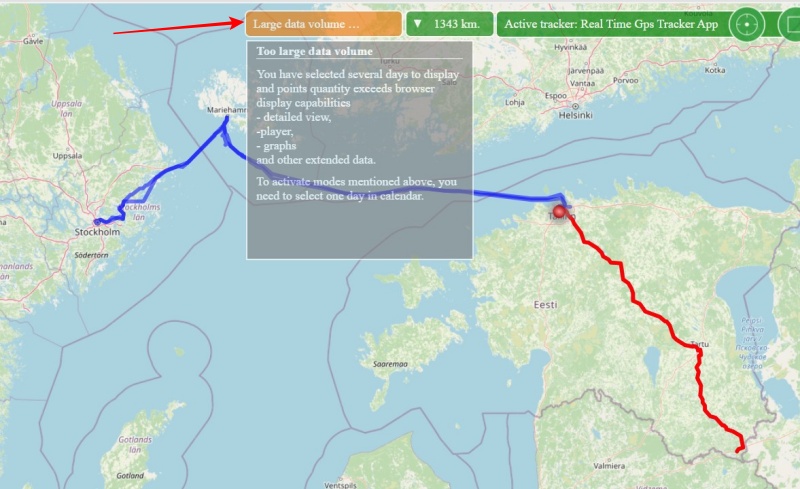
You can see how many points the track actually contains for the period, and how many of the bottom ones were displayed. To do this, after building the track, click on the panel where the track mileage is displayed. In the information window that opens, there is an item “Showing N track points out of M possible.”
Limitations imposed by a large number of points:
- Detail view not available
- Player not available
- Charts not available